
SciTech Tuesday–The German Tank Problem
During WWII the Allies wanted to find out how many weapons, and in particular tanks, the Germans were producing. The specific concern came as D-Day approached, and planners worried how the Sherman tank would perform. Encounters with the Panzer V in Italy and the Tinger 1 in Tunisia led to concerns that Western tanks would be outperformed, and were countered with the argument that norther France would be filled with lighter tanks, like the Panzer III and IV.
Military intelligence attempted to estimate the number of tanks being produced by the Germans from serial numbers on captured or destroyed tanks. This statistical approach, a new challenger to conventional methods of reconnaissance and spying, proved to be very accurate.
Scientists estimate the size of cryptic populations of animals, like mice or salamanders, by a mark and recapture method. The catch a few animals, mark and release them, and then trap some more. Based on the number of times a previously captured animal is recaptured, an estimate of the population size can be made. The less often a marked animal is recaptured, the bigger the whole population is estimated to be.
This method is not possible in the case of the tanks or other captured equipment. So how did they estimate the number produced? The math is slightly complicated, but I’ll explain the reasoning behind it.
Examination of serial numbers allows for the estimation of the largest possible number. For example, if the serial numbers follow the pattern XXX XXX XXX, then the largest possible number of tanks is 999,999,999—or just shy of 1 billion. This possible number is then compared to the actual serial numbers of captured or damaged tanks found. It is assumed that the tanks captured or damaged are randomly drawn from the population of all tanks. If that is true, then the serial numbers on them also should be randomly within the total number of tanks produced. By comparing the variation in the serial numbers of known tanks to the total possible number of tanks, with some calcuations you can estimate the total tanks actually produce. The more actual serial numbers they had to work with, the more accurate the estimate should be.
After WWII it was possible to look at production records and compare the statistically made estimates and the conventional intelligence estimates to the true production numbers. The statistical methods produced much better estimates of production. Conventional intelligence vastly overestimated production.
Over the years this mathematical approach to population size estimation has become a standard example for teaching probability. Using what has come to be called The German Tank Problem, teachers can provide an open-ended problem for students to work on. They can contrast two forms of estimation, Bayesian and Frequentist analyses, and compare models. The German Tank Problem is a standard part of contemporary AP Statistics courses in the US.
-
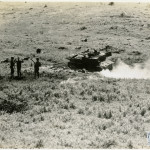
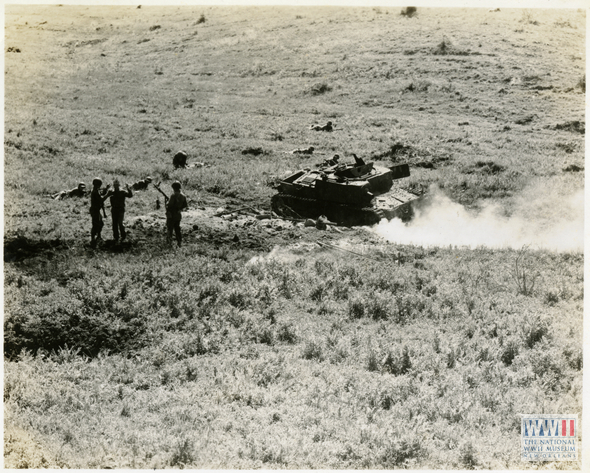
- In Italy, two US soldiers guard two surrendering German soldiers near their disabled tank.
-
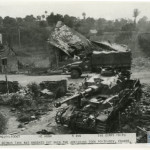
- A US truck passes behind a disabled German tank in France about a month after D-Day.

-
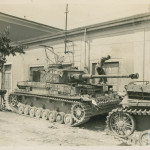
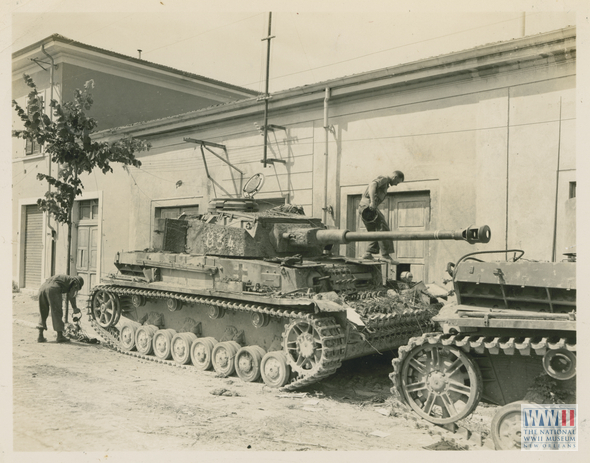
- US soldiers inspecting a disabled German tank in Italy in July of 1944.
In two weeks I’ll write about a viral disease that had a major impact on the WWII generation.
Posted by Rob Wallace, STEM Education Coordinator at The National WWII Museum

Leave a Reply